Monday, June 27, 2022

AFL Rankings: Round 15 2022


Geelong are second on the ladder, and Richmond are ninth. Geelong has a higher points differential, scoring shot differential, inside 50 differential, and ‘possession chain’ differential than Richmond this season (see table below). Why are Richmond ranked higher?


According to the rankings Richmond have had a slightly tougher fixture so far in 2022. Richmond’s average net margin in 2022 adjusted for estimated home ground advantage and opponent strength is 1.9 points higher than their average ‘raw’ net margin (see table below). In contrast, Geelong’s average adjusted net margin is 4.4 points lower than their average ‘raw’ net margin.


This ‘tougher’ fixture for Richmond mainly comes down to small differences – the Tigers have played Melbourne whereas Geelong hasn’t, and they haven’t played North Melbourne. If these matches were taken out Richmond’s average ‘raw’ net margin would actually be slightly higher than Geelong’s so far this season (see table above).

On the other hand, Richmond’s average net margin is driven a lot by their 109 point win against West Coast. If their games against the Eagles were excluded, Geelong average ‘raw’ net margin would actually be about two goals higher than Richmond’s.

In summary, they are probably similar, although Geelong does seem to have the more ‘sustainable’ profile of getting the ball and getting it into their forward line. We have seen this before though, with the Tigers stepping their performance up a notch in the finals. Geelong should have a better chance this year purely because they are currently seven spots higher on the ladder – but they would probably also want to keep things that way…


Tuesday, June 21, 2022

AFL Rankings: Round 14 2022


There was an entertaining game between GWS and the Bulldogs on the weekend where both teams scored over 100 points (125 to 105). It does seem like scoring is a tad up this year – is that right?

Well, yes – it is a tad up. The average points scored by a team per game so far in 2022 is 82.4 points, up from 79.6 points in 2021 (see table below). The average scoring shots is up by 0.6 per game, and the average inside 50s is up by 0.3 per game. These figures are also all slightly up on 2019 (2020 had shorter quarters).

Scoring is still well down from a decade ago. Teams still got the ball inside 50 about 50 times per game – as they have pretty much every year since the statistics was first recorded – but they more often converted inside 50s into scoring shots (see table above).

According to an article on the AFL website earlier this year, ‘transition’ from defence of the ball has improved this season, which was claimed as a main reason for the uptick in scoring. At the time the article was published, chains to inside 50 from both kick-ins and defensive 50 had risen significantly. The average number of tackles and stoppages had declined (although the percentage of secondary stoppages was steady).

Matches like the Giants-Bulldogs clash this season are still very much the rarity, not the norm. It’s still a 4 per cent increase in scoring so far though, so for those who prefer higher scoring it’s something. 


Tuesday, June 14, 2022

AFL Rankings: Round 13 2022


Making the opposition look better

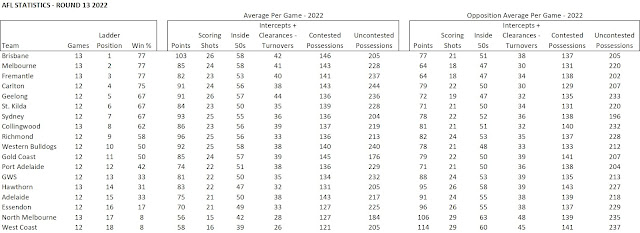
After this week, 12 out of 18 AFL teams have a positive ranking, meaning they are ranked as ‘above average’. The same number of teams have a percentage of over 100 (more points scored than against) this season. It seems like the competition is looking pretty strong, right?

Well, AFL is a zero-sum competition. And a large part of the reason we have so many teams rated above the average is that there are two teams that are way, way below it: North Melbourne and the West Coast Eagles.

North Melbourne and West Coast are not just the ‘worst’ teams in the AFL this year, they are two of the ‘worst’ teams there have ever been. On average they have scored almost nine goals per match less than their opposition so far this season. In comparison, North Melbourne in 2021 when they were the bottom team ‘only’ averaged about five goals less per match than their opponents (see below).

The 2022 Kangaroos and Eagles are much worse than your ‘standard’ bottom team like the 2021 Kangaroos on almost every major measure. Their opponents are averaging over 20 more inside 50s per game, compared with the eight more inside 50s opponents averaged on the 2021 Roos (see table above). They are also averaging 55 more disposals per game, compared with around 25 per game for the opponents of last year’s Roos. Teams are easily winning both the contested and uncontested battles against these bottom two sides, averaging around 16 more contested possessions per game (2021 Roos: 11 per game).

So teams are benefitting this season not only from a worse North Melbourne, but another team that is performing just as poorly. Collectively the Roos and Eagles have this year lost 57 ranking points, meaning there is over three extra rankings points per team for the other teams to go around. (Gold Coast, Carlton, and Collingwood all have a current ranking of less than three points.)

All that said, Melbourne’s drop over the past few weeks has suddenly made the competition a fair bit closer. Some teams may be looking better due to the historically poor performances of the bottom two teams, but they are not ‘a world away’ now from the top teams either.


Tuesday, June 7, 2022

AFL Rankings: Round 12 2022

The Suns finally emerge

The Gold Coast Suns have been a disappointing team since they joined the AFL in 2011, winning about 25 per cent of their matches, and only once finishing higher than fourteenth. In the past few weeks though, they have played some great football, even if their biggest wins have come against bottom sides.

In the past two weeks they have beaten Hawthorn and North Melbourne by over ten goals – the type of demolition performance that they usually been on the other side of. As impressively though they beat Sydney away and Fremantle, and had a relatively close loss in Ballarat to the Western Bulldogs. These performances make them by far the most improved team on the rankings over the past five weeks, improving by 20 points to be now rated around average overall.

The Suns are now for the first time comprehensively winning the territorial battle. They had an astonishing 81 inside 50s to 36 on the weekend against the hapless Kangaroos. On the season they are now ranked fifth overall for inside 50 differential, behind the gun midfields of Melbourne and the Bulldogs, along with Geelong and Fremantle.

Wings? What wings?

Over the past five weeks in particular the Suns have become contested possession beasts, barely seeming to relying on much of an ‘outside’ game at all. Their contested possession differential of +14.2 and clearance differential +9.2 (see table above) would rank above all teams bar Carlton for contested possessions if applied over the season. Their contested possession ratio for the season is 45 per cent, compared with a league average of 39 per cent. Touk Miller and Matt Rowell lead the way here, currently ranking third and tenth this season for average contested possessions, while ruck Jarrod Witts leads the league for average hit outs. (The highest for average uncontested possessions is Noah Anderson, and he doesn’t even rank inside the top 50.)

Contested possessions do often win games, but it is hard to know how far this ‘extreme’ game style can take them. For now the answer seems to be: away from the bottom of the ladder. After a decade of watching players depart and being seen as largely irrelevant, they may as well try it…