Skin searing from the Camel smokers
and flannel sweat
Who knows of it
in this dry fume cloud within
this hole where senses shed their chokers
awake and soar?
(Damn beergum floor)
loose tongue smothered tasting sticky
gooey honey lick it up
suck from th’ golden pish-stained mug
sun-blesshed flesh an’ all th’ resht
a tonic for th’ soul
The next call comes
what’s done is done
stuck against the ambergris
but in the woods
a nest of queens
will sting me in my sleep
Saturday, December 9, 2006
Sunday, November 19, 2006
We don’t get no respect: Who gets snubbed by the All-Australian selectors?
Since its inception in 1991, the AFL All-Australian team has been a recurring source of debate for football followers everywhere. A principle of the selection process is that players are meant to be selected to the team irrespective of club representation. Nevertheless, this hasn’t stopped fans from feeling aggrieved whenever their particular team’s star players miss the cut. Teams that have had modest years at best have been known to have two or three representatives, while teams that have made the finals have sometimes had no representatives at all. Inevitably, this leads some fans to speculate that the selectors are overlooking their club’s players, or are biased towards players from other clubs.
In theory, over time, such anomalies should even out. For example, in 2005, Hawthorn had three representatives in the All-Australian team despite winning only five games. However, back in the first All-Australian team in 1991 Hawthorn had no representatives, despite winning 16 games and going on to win the premiership. But is this the case for every team? Do, for instance, the non-Victorian teams have more representatives than their win-loss records would suggest? Are the selectors pro-Carlton and anti-Collingwood? And who are the teams that, no matter how well they do, just don’t seem to get any respect?
Since All-Australian selection is based on players’ performances during the home-and-away season, one would expect that, all other things being equal, a team would be more likely to have a high average number of All-Australian representatives per season if, over the past sixteen seasons, they have won a high percentage of home-and-away games. As it turns out, this is not always the case, as shown below.
| Team | Winning % in H&A matches since 1991 |
| West Coast | 60.6 |
| Essendon | 58.6 |
| Port Adelaide | 58.2 |
| Geelong | 56.6 |
| Kangaroos | 56.1 |
| Adelaide | 52.4 |
| Bulldogs | 50.0 |
| Brisbane | 49.0 |
| Carlton | 49.0 |
| St. Kilda | 48.3 |
| Hawthorn | 47.7 |
| Sydney | 47.1 |
| Collingwood | 46.7 |
| Melbourne | 46.6 |
| Richmond | 43.0 |
| Fremantle | 40.5 |
| Fitzroy | 23.8 |
| Team | Avge. # of All-Australian reps. since 1991 |
| Adelaide | 2.1 |
| West Coast | 2.0 |
| Carlton | 1.9 |
| St.Kilda | 1.9 |
| Essendon | 1.5 |
| Sydney | 1.5 |
| Port Adelaide | 1.5 |
| Brisbane | 1.4 |
| Geelong | 1.3 |
| Bulldogs | 1.3 |
| Kangaroos | 1.3 |
| Hawthorn | 1.2 |
| Collingwood | 0.9 |
| Melbourne | 0.8 |
| Richmond | 0.7 |
| Fremantle | 0.5 |
| Fitzroy | 0.5 |
Based on the table above, there appears to be no ‘bias’ at the bottom end of the scale, as the teams with the lowest winning percentages since 1991 have also been the teams with the lowest average numbers of representatives in the All-Australian team per season. Things are not so straightforward higher up the ladder, however. Adelaide, Carlton, St. Kilda and Sydney appear to have a much higher average number of representatives in the All-Australian team than their win-loss records would suggest. On the other hand, Geelong and the Kangaroos appear to have been significantly under-represented.
The table above, however, is slightly misleading. The line in the graph below shows the predicted average number of All-Australians for each team given their winning percentage since 1991.[1] The under-represented teams are below the line, and the over-represented teams are above it. Clearly, the teams with the lowest winning percentages (Collingwood, Melbourne, Richmond and Fremantle) tend to have a much lower representation in the All-Australian team than their actual winning percentages would suggest. Most of the teams with high winning percentages (Essendon, Port Adelaide, Geelong and the Kangaroos) have also been under-represented. It is the teams in the middle of the pack (Adelaide, Carlton and St. Kilda) that the All-Australian selectors have tended to favour.
Winning percentages and Average No. of All-Australians (1991-2006)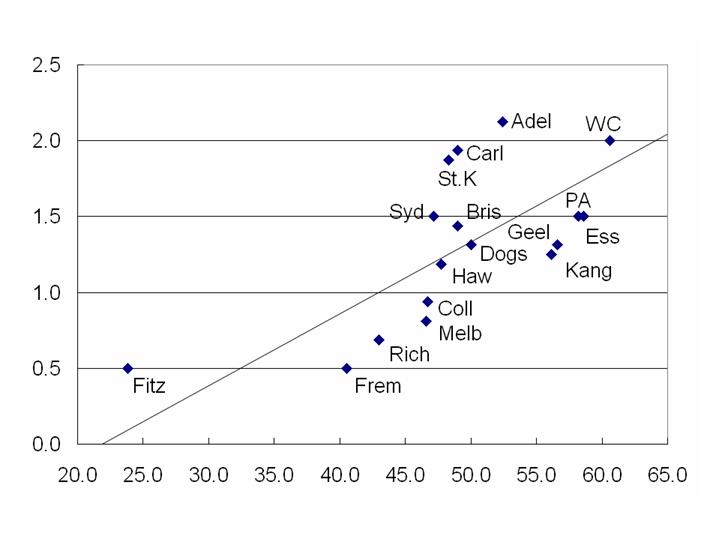
One possible theory for why teams with low winning percentages are relatively under-represented is that these teams tend to have ‘really bad’ seasons in which they clearly do not deserve any All-Australian selections. In fact, on average, the winning percentages of these teams during their ‘sub-par’ seasons (in which they win less than 50 per cent of their games) are no worse than the average club. Given their records in sub-par seasons, Melbourne, Richmond and Fremantle are all still under-represented during those seasons. Collingwood, on the other hand, is over-represented in sub-par seasons (otherwise known as the ‘Nathan Buckley effect’). Other teams that are noticeably over-represented in sub-par seasons include St. Kilda, the Bulldogs, Hawthorn, and particularly Adelaide. However, despite Adelaide’s reasonable record in sub-par seasons, winning a decent amount of games during your ‘bad’ seasons doesn’t tend to help your players’ chances of All-Australian selection that much. In particular, Geelong and the Kangaroos tend to win a significantly higher percentage of games than most other clubs during their bad seasons, but their players have either rarely or (in the Kangaroos’ case) never been rewarded with All-Australian selection in those years.
Winning percentages and Average No. of All-Australians in sub-par seasons
(1991-2006)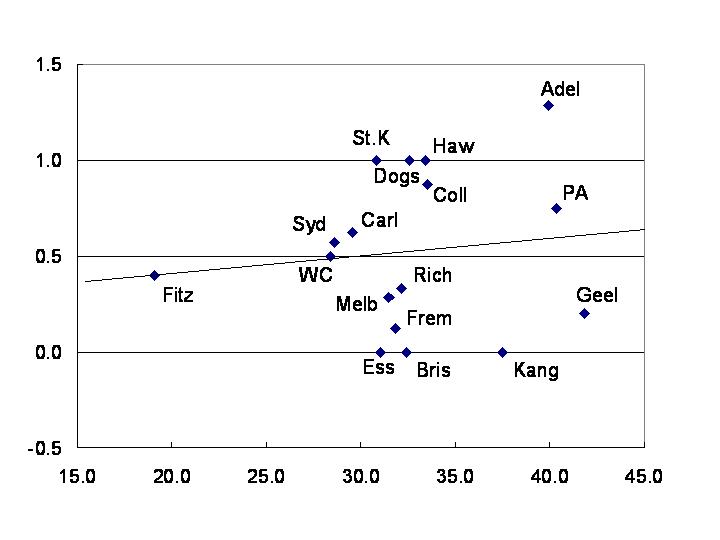
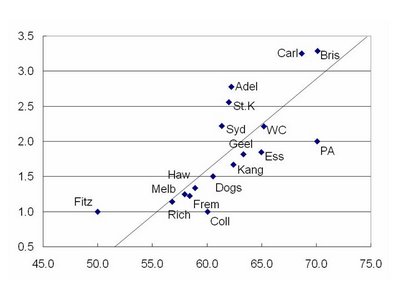
So how do teams fare when they have ‘above-par’ seasons (i.e. when they win 50 per cent or more of their games)? Again, Adelaide and St. Kilda are big winners given their records in those seasons, while Carlton and Brisbane also fare particularly well. Port Adelaide, on the other hand, is a big loser; their winning percentage in above-par seasons is much higher than most other clubs, yet there are several clubs who have a higher average number of All-Australians during those seasons. Collingwood’s players also tend to get overlooked whenever the Magpies have a good season, a fact that will validate the views of black-and-white fans everywhere. But this apparent snub notwithstanding, there may in fact be a good reason for Collingwood's under-representation overall. Compared to other clubs, Collingwood’s above-par seasons don’t tend to be ‘super’ seasons, that is, their winning percentage during those seasons is lower than the majority of clubs. Once your team’s winning percentage gets past 50 per cent, your players stand a much better chance of gaining All-Australian selection the more games you win than if your team’s winning percentage is less than 50 per cent (to see this, compare the slope of the line in the graph below to that in the one above). So it seems that the reason that Collingwood, Melbourne, Richmond and Fremantle are generally under-represented given their respective winning percentages is that they don’t tend to have really good seasons in which they would gain a whole swag of All-Australian selections (unless, of course, you’re Port Adelaide). In the end, being ‘middle of the road’ just doesn’t cut it with the selectors.
Winning percentages and Average No. of All-Australians in above-par seasons
(1991-2006)
Of course, we should note that just because a team is over-represented or under-represented in the All-Australian team, it doesn’t necessarily mean that there is any bias on the part of the selectors. For instance, fans of clubs that are under-represented in the All-Australian team may argue that their team is more than the sum of its parts. Or a team may have a strong group of players without having any noticeable stars. Or, alternatively, a team may have over or under-achieved given the talent on their list. A possible method of checking whether or not the selectors do in fact hold any biases towards or against particular teams is to see how many Brownlow Medal votes each team has received since 1991, and then compare this with their average number of All-Australian selections.
Nevertheless, some patterns seem to have emerged from the selections to date. Even so, there is no guarantee that such patterns will continue. Who knows – perhaps one day the selectors will decide that the Crows’ stars aren’t actually that good after all?
[1] Given they only played for six seasons after the All-Australian concept was introduced Fitzroy are excluded from the regression line.
Subscribe to:
Posts (Atom)