Thursday, May 31, 2012
Is This The Best Richmond Team Since 2001?
At this stage of the season (Round 9) they had better records in 2003, 2005, 2006, and 2011. In '06 and '11 though their percentage wasn't too good, indicating they were a crappy team waiting to happen. In 2003 their percentage was alright but not as good as this year.
This leaves 2005. In 2005 the Tigers had won 7 out of 9 games at this stage. However they had also played 6 of the bottom 8 teams. So I think there's a case to say that the 2012 version, which has had a tougher draw, is better. (Although if the 2005 team had not lost probably their best player at the time, Nathan Brown, mid-season they may well have made the top eight.)
Wednesday, May 30, 2012
How Even Is This AFL Season Really?
Not nearly as even as the pundits would have you believe. Take a look at this graph, which shows the variations in winning percentages and for/against percentages across AFL teams after Round 9 for every season since 2003:
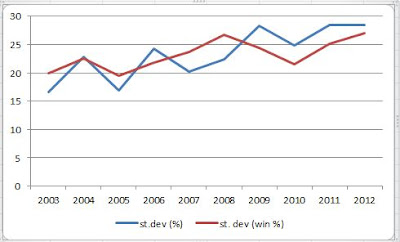
2012 is actually at the top for both categories, suggesting this is the most uneven season of the past decade. However, when the pundits talk about this being an even season, they are probably talking about the top 10 or 12 teams, and discounting GWS, Gold Coast and Melbourne. Given that North, Richmond and the Bulldogs are all on 16 points, let's take our cutoff as 13th spot where the Dogs sit. This graph shows the variations in winning percentages and for/against percentages across the top 13 AFL teams after Round 9 for every season since 2003:

Alright now the 2012 ladder is looking more even, particularly compared to 2011, although not as even as 2003 and 2007. Though maybe if you just took the results of the top 13 teams against each other (that is, exclude results involving the bottom teams), it might come out as the most even.
To put the point another way, consider this. This is the AFL ladder after Round 9 this season:
And this was the AFL ladder after Round 9 in 2003:
Which ladder looks the more even to you?

2012 is actually at the top for both categories, suggesting this is the most uneven season of the past decade. However, when the pundits talk about this being an even season, they are probably talking about the top 10 or 12 teams, and discounting GWS, Gold Coast and Melbourne. Given that North, Richmond and the Bulldogs are all on 16 points, let's take our cutoff as 13th spot where the Dogs sit. This graph shows the variations in winning percentages and for/against percentages across the top 13 AFL teams after Round 9 for every season since 2003:

Alright now the 2012 ladder is looking more even, particularly compared to 2011, although not as even as 2003 and 2007. Though maybe if you just took the results of the top 13 teams against each other (that is, exclude results involving the bottom teams), it might come out as the most even.
To put the point another way, consider this. This is the AFL ladder after Round 9 this season:
| WC | 9 | 32 | 142.6 |
| ES | 9 | 32 | 140.2 |
| AD | 9 | 28 | 127.4 |
| CW | 9 | 28 | 110.9 |
| SY | 9 | 24 | 130.7 |
| CA | 9 | 24 | 128.9 |
| SK | 9 | 20 | 118.8 |
| HW | 9 | 20 | 116.4 |
| GE | 9 | 20 | 103.7 |
| FR | 9 | 20 | 95.5 |
| NM | 9 | 16 | 112.7 |
| RI | 9 | 16 | 110.6 |
| WB | 9 | 16 | 93.2 |
| BL | 9 | 12 | 87.7 |
| PA | 9 | 12 | 86.7 |
| GW | 9 | 4 | 47.3 |
| GC | 9 | 0 | 60.2 |
| ME | 9 | 0 | 51.8 |
And this was the AFL ladder after Round 9 in 2003:
| BL | 9 | 30 | 124.6 |
| WC | 9 | 28 | 130 |
| PA | 9 | 24 | 119.5 |
| FR | 9 | 24 | 113.7 |
| RI | 9 | 24 | 107.9 |
| AD | 9 | 20 | 117.9 |
| SY | 9 | 20 | 107.2 |
| CW | 9 | 20 | 105.1 |
| KA | 9 | 18 | 93.4 |
| ES | 9 | 16 | 99.8 |
| SK | 9 | 16 | 84.7 |
| ME | 9 | 12 | 87.7 |
| HW | 9 | 12 | 84.1 |
| CA | 9 | 12 | 81 |
| GE | 9 | 8 | 84 |
| WB | 9 | 4 | 82.4 |
Which ladder looks the more even to you?
Monday, May 28, 2012
What Has Happened To West Coast?
As noted in this week’s AFL Power Rankings, at the
start of 2011 West Coast were considered the worst team in the competition. But
in a bit over a year the very same rankings show them to the best team in the
competition, and they sit on top of the AFL ladder.
How have the Eagles become so good so quickly? A few weeks back I looked at the reasons for Collingwood’s drop off in form, using average Champion Data (SuperCoach) player ratings for their main 22 players in 2011 and 2012. I found then that the reason for the Pies’ relatively cold streak appeared to be mainly due to injuries, and conjectured that they would get better as players returned.
For the Eagles though the reasons for their improvement are more multi-faceted than this. In 2010, when they finished last, a lot of things went wrong for them. Since then a lot of things have gone right. Let’s start by looking at the average player ratings for their main 22 players in each of 2010 and 2011.
A couple of points to note: first, the Eagles had a lot of injuries in 2010. Picking their main 22 was a tough task, but in both 2010 and 2011 I’ve picked the 22 players who played the most games, even though Andrew Strijk gets into the Eagles’ main 22 in 2010 with just 10 games. Second, I think that Champion Data adjusted their formulas between 2010 and 2011 so that ruckmen were rated more highly, so keep this mind when looking at the scores of Dean Cox and Nic Naitinui.
That said, these seem to be the main reasons why the Eagles improved so much from 2010 to 2011:
Again, the return of some senior players (Cox, Kerr, Glass) to full health has helped, and the new additions (Shuey, Gaff, Darling) have been even better in 2012. Part of the story though may be a natural maturation of players: some players that are now reaching their mid-20s (Beau Waters, Will Schofield, Matt Rosa, Eric MacKenzie, Shannon Hurn) all seem to have improved somewhat, and some players that are now in their early-20s — Selwood, Naitanui, and Chris Masten — appear to have improved dramatically. Or maybe coach John Worsfold has just picked up his game in getting this team to perform! Either way, given that most of this team is still quite young, we could see some more improvement yet.
How have the Eagles become so good so quickly? A few weeks back I looked at the reasons for Collingwood’s drop off in form, using average Champion Data (SuperCoach) player ratings for their main 22 players in 2011 and 2012. I found then that the reason for the Pies’ relatively cold streak appeared to be mainly due to injuries, and conjectured that they would get better as players returned.
For the Eagles though the reasons for their improvement are more multi-faceted than this. In 2010, when they finished last, a lot of things went wrong for them. Since then a lot of things have gone right. Let’s start by looking at the average player ratings for their main 22 players in each of 2010 and 2011.
| Supercoach Average | |||
| 2010 | 2011 | Diff. | |
| Dean Cox | 88.00 | 116.68 | 28.68 |
| Nic Naitanui | 71.18 | 94.61 | 23.43 |
| Josh Kennedy | 67.14 | 84.96 | 17.82 |
| Scott Selwood | 64.90 | 82.64 | 17.74 |
| Quinten Lynch | 64.57 | 80.50 | 15.93 |
| Matt Rosa | 79.40 | 86.89 | 7.49 |
| Will Schofield | 53.05 | 58.74 | 5.69 |
| Matt Priddis | 108.79 | 113.16 | 4.37 |
| Andrew Embley | 86.70 | 90.46 | 3.76 |
| Mark Lecras | 82.19 | 83.50 | 1.31 |
| Patrick McGinnity | 58.06 | 57.26 | -0.80 |
| Shannon Hurn | 84.60 | 82.48 | -2.12 |
| Brad Ebert | 70.55 | 62.95 | -7.60 |
| Adam Selwood | 91.62 | 63.16 | -28.46 |
| Beau Waters | 82.14 | ||
| Ashton Hams | 72.45 | ||
| Andrew Strijk | 65.20 | ||
| Eric MacKenzie | 64.22 | ||
| Brad Sheppard | 59.93 | ||
| Mitch Brown | 57.54 | ||
| Tom Swift | 56.23 | ||
| Chris Masten | 50.23 | ||
| Luke Shuey | 93.92 | ||
| Daniel Kerr | 92.56 | ||
| Sam Butler | 81.92 | ||
| Mark Nicoski | 71.60 | ||
| Jack Darling | 70.91 | ||
| Andrew Gaff | 63.65 | ||
| Ashley Smith | 62.56 | ||
| Darren Glass | 54.46 | ||
| Changed players | 507.94 | 591.58 | 83.64 |
| Total | 1578.69 | 1749.57 | 170.88 |
A couple of points to note: first, the Eagles had a lot of injuries in 2010. Picking their main 22 was a tough task, but in both 2010 and 2011 I’ve picked the 22 players who played the most games, even though Andrew Strijk gets into the Eagles’ main 22 in 2010 with just 10 games. Second, I think that Champion Data adjusted their formulas between 2010 and 2011 so that ruckmen were rated more highly, so keep this mind when looking at the scores of Dean Cox and Nic Naitinui.
That said, these seem to be the main reasons why the Eagles improved so much from 2010 to 2011:
· Of the players who were 'core' in both 2010 and 2011,
there was a significant improvement in production in 2011 by Cox, Scott Selwood, Josh Kennedy,
Naitanui, and Quinten Lynch. Lynch was hampered by injury in 2010, and even
though Cox played every game in 2010 it was clear at the time he was hampered
too. The other three players are all very young, so it is not too big a
surprise to see that they improved.
· Apart from Cox and Lynch, Daniel Kerr,
Sam Butler, Mark Nicoski and Darren Glass also suffered from injuries in 2010,
and their return in 2011 seemed to help the side. By ‘help the side’ I mean one
could say that they were better than the players they replaced (although in the
case of a key defender like Glass it’s hard to tell this from the ratings).
· The new players in West Coast’s main 22 were
all useful additions: namely Luke Shuey, Andrew Gaff and Jack Darling
(particularly Shuey).
The Eagles have maintained their form, and possibly
improved, in 2012. Let’s see how the 2012 team compares with that 2010
campaign:| Supercoach Average | |||
| 2010 | 2012 | Diff. | |
| Scott Selwood | 64.90 | 110.89 | 45.99 |
| Chris Masten | 50.23 | 91.44 | 41.21 |
| Nic Naitanui | 71.18 | 105.43 | 34.25 |
| Beau Waters | 82.14 | 102.22 | 20.08 |
| Dean Cox | 88.00 | 107.44 | 19.44 |
| Will Schofield | 53.05 | 69.14 | 16.09 |
| Matt Rosa | 79.40 | 94.12 | 14.72 |
| Eric MacKenzie | 64.22 | 76.38 | 12.16 |
| Shannon Hurn | 84.60 | 95.78 | 11.18 |
| Quinten Lynch | 64.57 | 66.44 | 1.87 |
| Ashton Hams | 72.45 | 69.33 | -3.12 |
| Josh Kennedy | 67.14 | 61.20 | -5.94 |
| Matt Priddis | 108.79 | 94.71 | -14.08 |
| Patrick McGinnity | 58.06 | 43.33 | -14.73 |
| Adam Selwood | 91.62 | 53.38 | -38.24 |
| Andrew Embley | 86.70 | ||
| Mark Lecras | 82.19 | ||
| Brad Ebert | 70.55 | ||
| Andrew Strijk | 65.20 | ||
| Brad Sheppard | 59.93 | ||
| Mitch Brown | 57.54 | ||
| Tom Swift | 56.23 | ||
| Luke Shuey | 110.67 | ||
| Andrew Gaff | 93.89 | ||
| Josh Hill | 79.11 | ||
| Daniel Kerr | 77.33 | ||
| Jack Darling | 76.78 | ||
| Darren Glass | 68.12 | ||
| Sam Butler | 67.20 | ||
| Changed players | 478.34 | 573.10 | 94.76 |
| Total | 1578.69 | 1814.33 | 235.64 |
Again, the return of some senior players (Cox, Kerr, Glass) to full health has helped, and the new additions (Shuey, Gaff, Darling) have been even better in 2012. Part of the story though may be a natural maturation of players: some players that are now reaching their mid-20s (Beau Waters, Will Schofield, Matt Rosa, Eric MacKenzie, Shannon Hurn) all seem to have improved somewhat, and some players that are now in their early-20s — Selwood, Naitanui, and Chris Masten — appear to have improved dramatically. Or maybe coach John Worsfold has just picked up his game in getting this team to perform! Either way, given that most of this team is still quite young, we could see some more improvement yet.
Sunday, May 27, 2012
The Finger Points Outwards - No. 41: Eurovision Bloc Voting
On watching the Eurovision Song Contest, I again wondered if someone had tried to prove or disprove whether "bloc voting" takes place. Sure enough they have, and the results accord fairly well with my expectations. That is, bloc voting did start to pick up in the '90s, and gather momentum into the new millennium. Also, that bloc voting may affect who the eventual winner is, but only rarely. Certainly it didn't seem to affect it in 2012!
AFL Power Rankings: Round 9 2012
And the big guns keep crumbling... Hawthorn's second 'shocker' for the year - a huge loss against the Tigers - sees them fall from the top spot. The new #1 is West Coast; an amazing result given that they begun last year at the bottom of the table.
In contrast to 2011, we may well see quite a bit of shuffling over the next few weeks in what is shaping up as an even season. All of the top ten are just two or three big wins from grabbing the #1 rank, making it harder to gauge just who is the best team out there.
1 (3) West Coast 23.1 (21.7)
2 (2) Geelong 22.2 (23.8)
3 (1) Hawthorn 19.6 (27.4)
4 (4) Collingwood 18.9 (18.0)
5 (5) Carlton 15.6 (14.7)
6 (7) St. Kilda 14.9 (13.0)
7 (6) Sydney 13.2 (14.3)
8 (8) Essendon 10.8 (7.6)
9 (11) Richmond 8.0 (-1.2)
10 (9) Adelaide 6.7 (7.1)
11 (10) North Melbourne 2.4 (3.3)
12 (12) Western Bulldogs -4.8 (-6.6)
13 (13) Fremantle -12.0 (-11.0)
14 (14) Brisbane -14.7 (-17.0)
15 (15) Port Adelaide -28.4 (-33.3)
16 (16) Melbourne -40.2 (-40.3)
17 (17) Gold Coast -54.4 (-50.6)
18 (18) Greater Western Sydney -56.2 (-53.8)
Sunday, May 20, 2012
AFL Power Rankings: Round 8 2012
The big mover this week - in the wrong direction - is Carlton, who crash from second to fifth after their big defeat in Melbourne to the Crows. Adelaide, meanwhile, have shot from thirteenth to ninth in the past two weeks with two great wins.
1 (1) Hawthorn 27.4 (28.3)
2 (3) Geelong 23.8 (25.3)
3 (4) West Coast 21.7 (20.6)
4 (5) Collingwood 18.0 (16.1)
5 (2) Carlton 14.7 (25.4)
6 (7) Sydney 14.3 (9.7)
7 (6) St. Kilda 13.0 (14.6)
8 (8) Essendon 7.6 (6.9)
9 (11) Adelaide 7.1 (-3.9)
10 (9) North Melbourne 3.3 (6.0)
11 (10) Richmond -1.2 (0.8)
12 (12) Western Bulldogs -6.6 (-5.7)
13 (13) Fremantle -11.0 (-10.5)
14 (14) Brisbane -17.0 (-19.9)
15 (15) Port Adelaide -33.3 (-36.4)
16 (16) Melbourne -40.3 (-36.6)
17 (18) Gold Coast -50.6 (-51.2)
18 (17) Greater Western Sydney -53.8 (-50.3)
Monday, May 14, 2012
AFL Power Rankings: Round 7 2012
This week we have a new No. 1 - Hawthorn, which might seem a bit strange given that they were ranked fourth a couple of weeks back, and on the actual AFL ladder they are not even in the eight! However, the Hawks' rivals (particularly Geelong) have crumbled around them over the past couple of weeks, and their only 'bad' performance for the year so far has been the loss against Sydney; their other losses have been narrow defeats to the Cats and the Eagles in Perth.
Meanwhile, the team that some are calling a premiership contender - Essendon - are in eighth spot. The hype around the Bombers has stemmed from their performances over the past four weeks, during which they have been phenomenal, earning double the ranking points of any other team. (Hawthorn have been the second best team over those four weeks, and the Bombers' opponents next weekend - Richmond - have been the third best.)
And at the bottom of the rankings, the GWS Giants' win over the GC Suns has lifted them out of the last spot.
1 (2) Hawthorn 28.3 (26.2)
2 (3) Carlton 25.4 (28.0)
3 (1) Geelong 25.3 (32.9)
4 (4) West Coast 20.6 (27.9)
5 (5) Collingwood 16.1 (14.8)
6 (7) St. Kilda 14.6 (11.3)
7 (6) Sydney 9.7 (13.2)
8 (9) Essendon 6.9 (1.0)
9 (8) North Melbourne 6.0 (9.3)
10 (10) Richmond 0.8 (-1.9)
11 (13) Adelaide -3.9 (-11.2)
12 (11) Western Bulldogs -5.7 (-8.8)
13 (12) Fremantle -10.5 (-9.4)
14 (14) Brisbane -19.9 (-16.9)
15 (16) Port Adelaide -36.4 (-35.7)
16 (15) Melbourne -36.6 (-35.0)
17 (18) Greater Western Sydney -50.3 (-52.1)
18 (17) Gold Coast -51.2 (-48.2)
The Best Goalkicking Season In VFL/AFL History
We often hear nowadays how the era of the 100-goal-a-year full-forward are over, and with the leading goalkicker this year - Taylor Walker - only having kicked 20 goals in 6 matches that trend looks set to continue. On the other hand, back in the ‘70s and ‘80s average scores used to be higher, so maybe the general fall in scoring is contributing to this trend. And thinking about this led to another question: just which is the most impressive goalkicking season by a player in VFL/AFL history?
To investigate this I went back over the leading goalkickers for each season and evaluated them according to a metric that, for want of a better term, I’ll call a “Goal Efficiency Rating”. The formula for this rating is as follows:
Goal Efficiency Rating = Goals kicked by player in home-and-away season / [Average goals per match for home-and-away season (all teams) * Number of matches in home-and-away season]
Essentially to calculate the rating a player’s goal total over the season is divided by the average number of goals that would be expected to be kicked in a team’s matches over that season. For example, in 1970 Peter Hudson kicked 146 goals in the home-and-away season. The average number of goals per match that season was 24.77 and there were 22 matches, so the average number of goals that would be expected to be kicked in a given team’s matches in the 1970 season is about 545. In kicking 146 goals for the season, Peter Hudson kicked 26.80 per cent of the goals that would be expected to be kicked in a given team’s matches over that season. (Note this is different from the actual percentage of goals that Hudson kicked in Hawthorn’s matches that season.)
Using this formula, the best goalkicking season home-and-away season ever is... Gordon Coventry in 1929. Coventry kicked 118 goals when the average number of goals that would be expected to be kicked in a given team’s matches in the 1929 season was about 387 (21.55 goals per match multiplied by 18 matches). Bob Pratt’s 1934 season (where he kicked 138 in the home-and-away season, and 150 overall) comes in second, and John Coleman’s 1952 season comes in third.
Below are the ‘Goal Efficiency Ratings’ for every leading goalkicker since 1897. Leading goalkickers in the 2000s tend to be near the bottom of the table, suggesting that the modern era does indeed have the least reliance on full-forwards. In fact the 2011 Coleman Medallist, Lance Franklin, comes in at second last on the table. (Only leading goalkickers are included in the table, so for example, Peter McKenna's 1970 season goal tally isn't included.)


Some of the modern-day 100 goal seasons take a battering in these rankings, as scoring is relatively higher than it was in, say, the ‘20s or ‘30s, and more matches are played. So the drop in reliance on the full-forward to kick goals seems to have been happening for a while, but it hasn't really been noticed due to the higher scoring.
John Coleman comes in three times in the Top 10 "GER"s, while Peter Hudson and Gordon Coventry make the Top 10 twice. Again, makes you wonder what Coleman would have done if he played more than 98 games, doesn’t it?
Sunday, May 6, 2012
AFL Power Rankings: Round 6 2012
Quite a lot of minor shuffling this week in the placings, with perhaps the most notable move being Hawthorn nabbing second spot from the Blues. Minor shuffling aside, based on ranking points the teams can currently be broken up into the following tiers:
1st tier: Geelong, Hawthorn, Carlton, West Coast
2nd tier: Collingwood, Sydney, St. Kilda, North Melbourne
3rd tier: Essendon, Richmond
4th tier: Western Bulldogs, Fremantle, Adelaide
5th tier: Brisbane
6th tier: Melbourne, Port Adelaide
7th tier: Gold Coast, Greater Western Sydney
1 (1) Geelong 32.9 (35.9)
2 (4) Hawthorn 28.9 (26.2)
3 (2) Carlton 28.0 (29.9)
4 (3) West Coast 27.9 (27.7)
5 (6) Collingwood 14.8 (16.0)
6 (5) Sydney 13.2 (16.2)
7 (7) St. Kilda 11.3 (13.1)
8 (8) North Melbourne 9.3 (8.3)
9 (10) Essendon 1.0 (-3.5)
10 (9) Richmond -1.9 (-3.3)
11 (12) Western Bulldogs -8.8 (-10.6)
12 (11) Fremantle -9.4 (-7.8)
13 (14) Adelaide -11.2 (-15.8)
14 (13) Brisbane -16.9 (-13.5)
15 (16) Melbourne -35.0 (-38.3)
16 (15) Port Adelaide - 35.7 (-34.5)
17 (17) Gold Coast -48.2 (-49.5)
18 (18) Greater Western Sydney -52.1 (-55.5)
Saturday, May 5, 2012
What Has Happened To Collingwood?
So far in the 2012 AFL season Collingwood has not
been the dominant team they were in 2010 or 2011. In 2011 they beat every team
except the eventual premier Geelong, usually quite easily. In 2012 so far they
have lost to Hawthorn and Carlton, and haven’t beaten any of their other
opponents – all of which finished no higher than 8th last season –
by more than four goals.
But what is the reason for this drop off in form?
Have a few players gone off the boil or is there a general malaise? Let’s
compare the average Champion Data (SuperCoach) player ratings for Collingwood’s
main 22 players in 2011 and 2012.
Supercoach Average
|
|||
2011
|
2012
|
Diff.
|
|
Luke Ball
|
99.21
|
62.67
|
-36.54
|
Chris Tarrant
|
52.30
|
17.00
|
-35.30
|
Ben Johnson
|
79.44
|
49.33
|
-30.11
|
Dale Thomas
|
109.67
|
86.33
|
-23.34
|
Ben Reid
|
77.88
|
59.75
|
-18.13
|
Chris Dawes
|
76.28
|
61.00
|
-15.28
|
Travis Cloke
|
97.32
|
93.67
|
-3.65
|
Heath Shaw
|
99.59
|
96.25
|
-3.34
|
Dane Swan
|
120.62
|
119.00
|
-1.62
|
Scott Pendlebury
|
129.76
|
129.17
|
-0.59
|
Sharrod Wellingham
|
74.90
|
74.50
|
-0.40
|
Harry O'Brien
|
74.96
|
76.00
|
1.04
|
Alan Toovey
|
61.25
|
62.83
|
1.58
|
Dayne Beams
|
93.50
|
95.40
|
1.90
|
Darren Jolly
|
81.62
|
87.80
|
6.18
|
Jarryd Blair
|
73.96
|
81.20
|
7.24
|
Nick Maxwell
|
61.58
|
70.00
|
8.42
|
Steele Sidebottom
|
84.32
|
105.00
|
20.68
|
Leon Davis
|
101.57
|
||
Andrew Krakouer
|
76.00
|
||
Leigh Brown
|
67.17
|
||
Alan Didak
|
57.25
|
||
Martin Clarke
|
81.00
|
||
Alex Fasolo
|
67.50
|
||
Tyson Goldsack
|
60.83
|
||
Lachlan Keeffe
|
57.67
|
||
Ben Sinclair
|
56.17
|
||
Changed players
|
354.29
|
323.17
|
-31.12
|
Total
|
1850.15
|
1750.07
|
-121.26
|
The table has been divided up into several groups. At
the top of the table we see there are 6 players who have had a large drop-off
in form in 2012: Luke Ball, Chris Tarrant, Ben Johnson, Dale Thomas, Ben Reid
and Chris Dawes. However, with the exception of Dawes, all of those players
have been hampered by injury in 2012. Therefore it looks like injuries really
are a significant reason for the Pies’ drop-off in form. Many of the other core
Collingwood players – Cloke, Shaw, Swan, Pendlebury, Wellingham, O’Brien,
Toovey and Beams – are pretty much the same players they were in 2011. A few
players have marginally improved, including Jolly, Blair and Maxwell, though both
Jolly and Maxwell missed significant portions of 2011 with injury. And one
player – Steele Sidebottom – has significantly improved, though given that both
he and Blair are young it shouldn’t be too surprising that they have improved
from last year.
Further down the list we see the core players from
2011 that Collingwood are missing in 2012, including Davis, Krakouer, Brown,
and Didak. Given that Tarrant has only played one game so far he could also be
included in this group. Replacing them in Collingwood’s main 22 have been
Clarke, Fasolo, Goldsack, Keeffe and Sinclair. These five players have so far
averaged 31 less ranking points (about 2 per cent of the team’s productivity in
2011) than the players they replaced. The main loss here has been Leon Davis,
with Marty Clarke being a capable but not as productive replacement. Overall
though the main 22 is producing 121 less ranking points per game than 2011, a 7
per cent drop in productivity. Pretty much all of this can be attributed to
Ball, Johnson, Thomas, Reid and Dawes, with Davis’ loss offsetting Sidebottom’s
improvement.
So in summary then it looks like injuries and the
loss of Leon Davis has led to Collingwood’s fall so far in 2012. (Though the
Pies did drop off towards the end of 2011 as well.) The good news for
Collingwood supporters then is that the team may well improve again as these
players become healthy again, though Ball is out for the season and Davis is
not returning. In other words, it may not be new coach Nathan Buckley’s fault
after all.
Subscribe to:
Posts (Atom)